Sources: Historical interest rates – NS&I, Finder.com
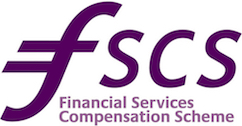
ISA Performance Comparison
You can save up to £20,000 per tax year into our Lump Sum ISA, tax-free, with the potential of higher returns over the medium/long term than a cash ISA. The graph below shows how our Lump Sum ISA performed compared to the NS&I Direct ISA and the average UK Cash ISA.
Please note these figures relate to past performance of our With-Profits Fund and you should not rely on them as a forecast of future returns.
Our With-Profits Fund is designed to grow Members’ money over time, and the longer your money is invested, the greater the potential for growth.
Based on past performance of the Fund, the examples below show the returns achieved as a lump sum investment or by investing regular premiums into our ISA.
The graphs also provide details of how annual and final bonuses add to your investment.
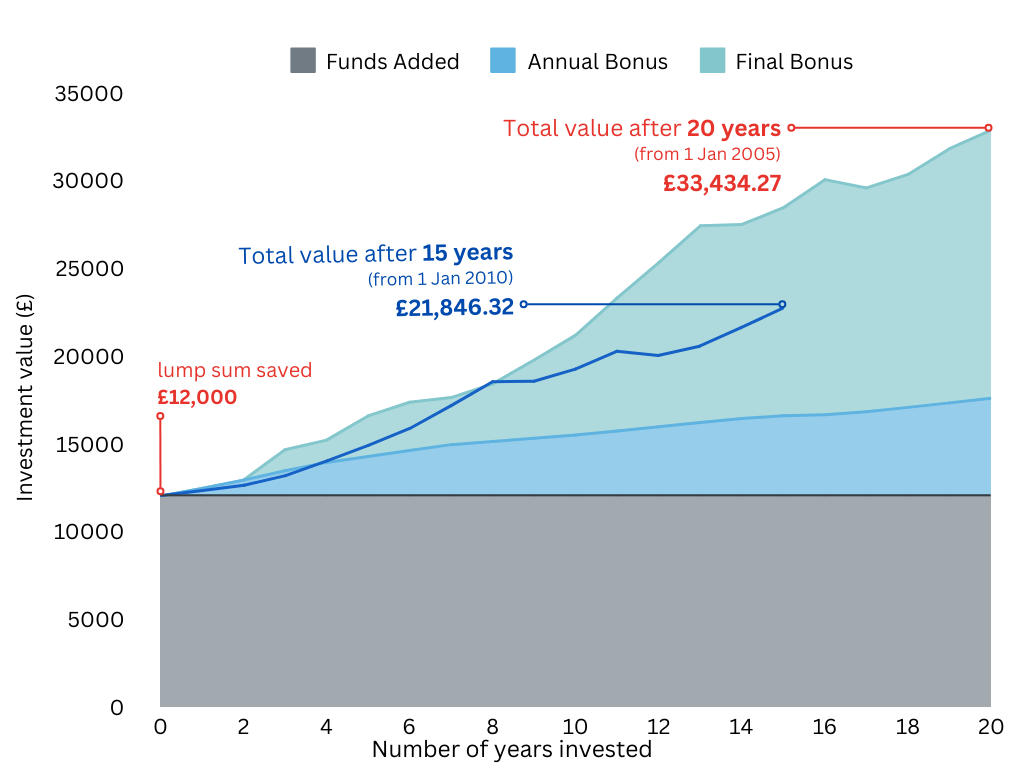
Lump Sum Growth
This graph shows the return achieved over 20 years on £12,000 invested in a Metfriendly ISA on 1 January 2005.
The total value shown is the cash in amount as of 1 January 2025 which includes the initial funds plus the annual and final bonuses.
Also shown on the graph is the return achieved over 15 years on £12,000 invested on 1 January 2010, with a cash in value as of 1 January 2025.
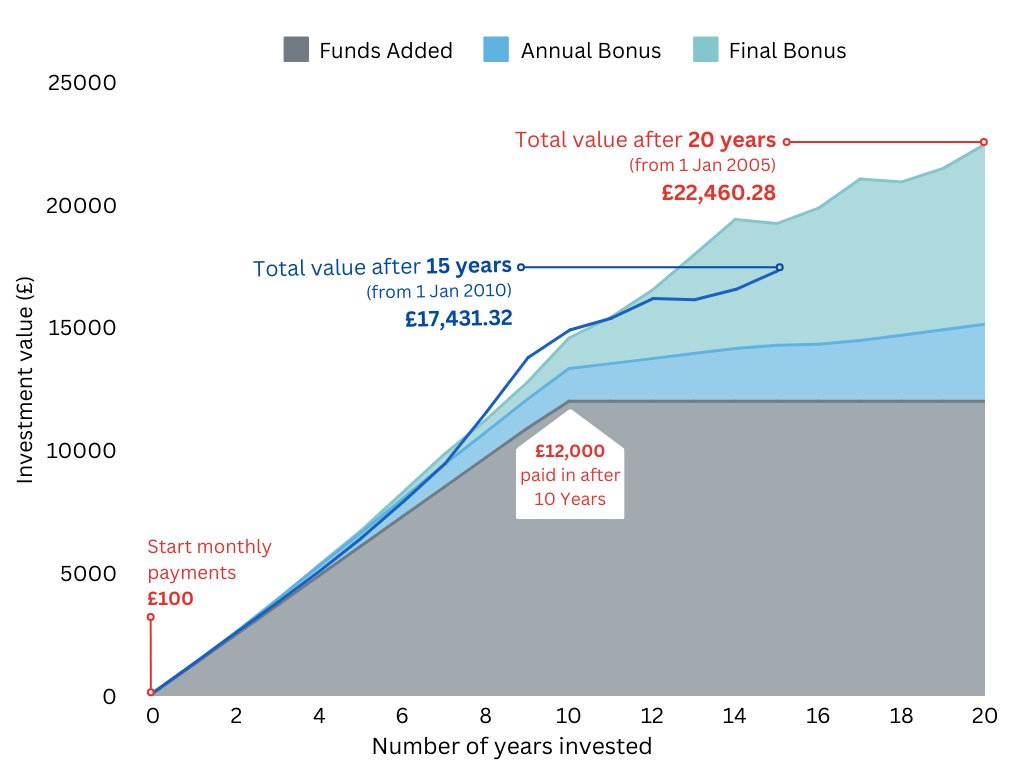
Monthly Savings Growth
This graph shows the return achieved over 20 years, having paid £100 a month into a Metfriendly ISA for 10 years starting on 1 January 2005, with no further payments after the initial 10 years.
The total value shown is the cash in amount as of 1 January 2025 which includes all payments made plus the annual and final bonuses.
Also shown on the graph is the return achieved over 15 years, having paid £100 a month into a Metfriendly ISA for 10 years starting on 1 January 2010, with no further payments after the initial 10 years.